The Problem
Residential solar involves two systems: the solar company tracks what your panels produce and what your home consumes, while the utility manages billing, rate structures, and net metering credit policies. Understanding the full financial picture requires combining data from both sides, including production patterns from SolarEdge, credit expiration rules from Maine's net energy billing program, and the pricing logic behind each of CMP's rate plans. Without that integration, homeowners cannot answer basic questions like whether they are on the optimal rate plan or how close they are to paying off their system.
The Solution
An automated monitoring dashboard that ingests production and consumption data every 15 minutes from the SolarEdge API, combines it with utility billing data, and presents a comprehensive financial picture. The system tracks net metering credits under Maine's 12-month FIFO expiration policy, models bill scenarios across three CMP rate plans, and calculates real-time ROI progress toward system payback.
The system is built around Maine's specific rate structures and Net Energy Billing program rules. Credit expiration, the differences between Rate A, Electric Technology, and Time-of-Use pricing, and how CMP handles supply versus delivery charges all shape what the right answer looks like for a Maine homeowner, and the calculations are written to match.
Key Features
- Automated data collection every 15 minutes via SolarEdge API
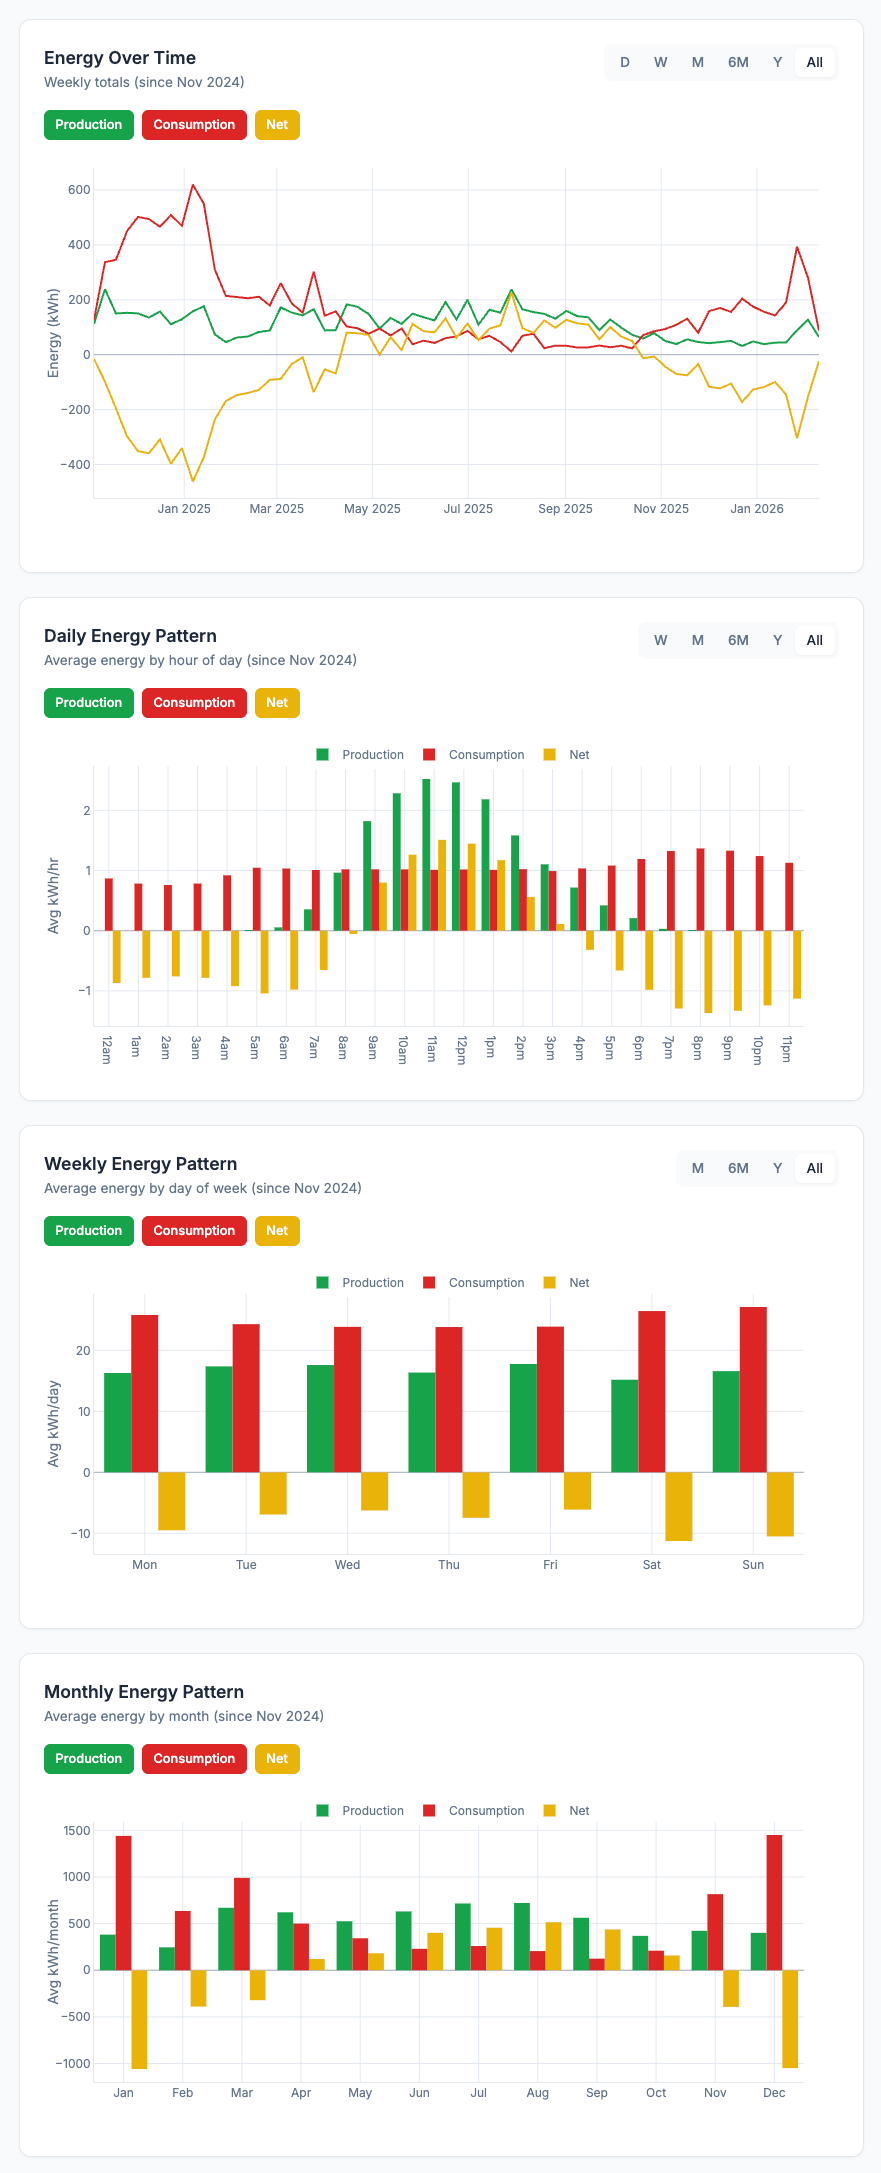
- Interactive energy charts with toggleable production, consumption, and net energy views across daily, weekly, and monthly timeframes
- Net metering credit tracking with FIFO expiration logic matching Maine's 12-month NEB policy
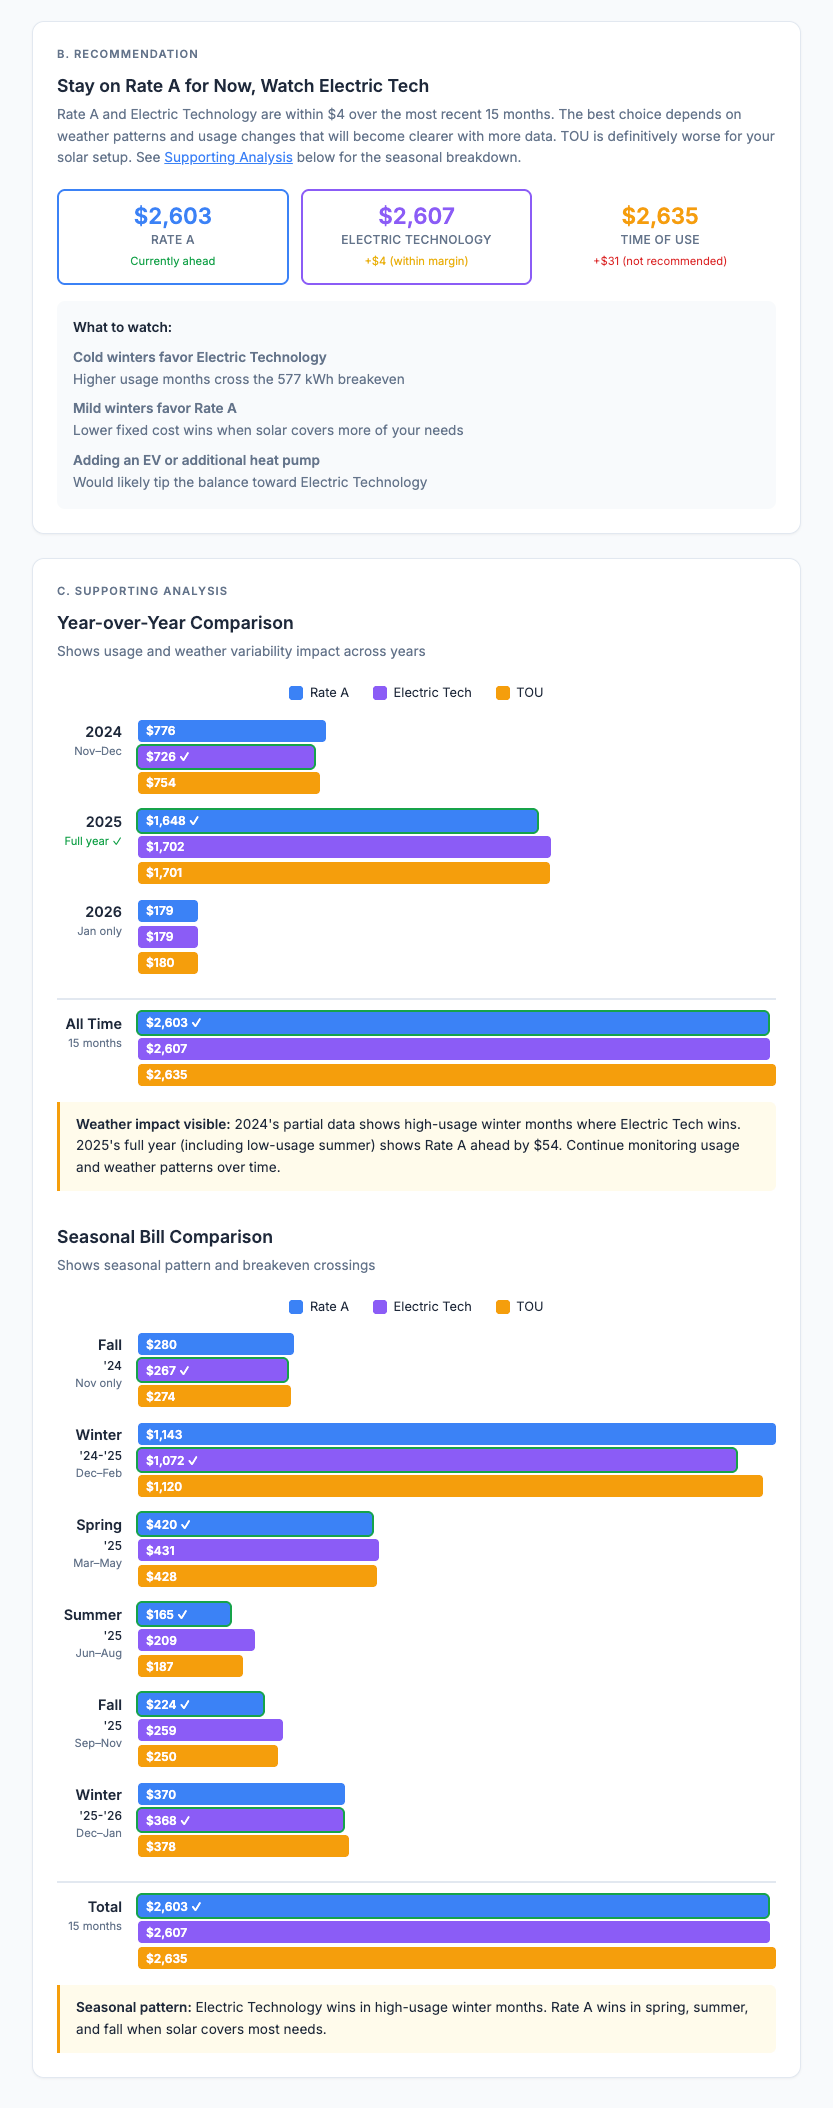
- Rate plan comparison modeling monthly bills across CMP Rate A, Electric Technology, and Time-of-Use plans
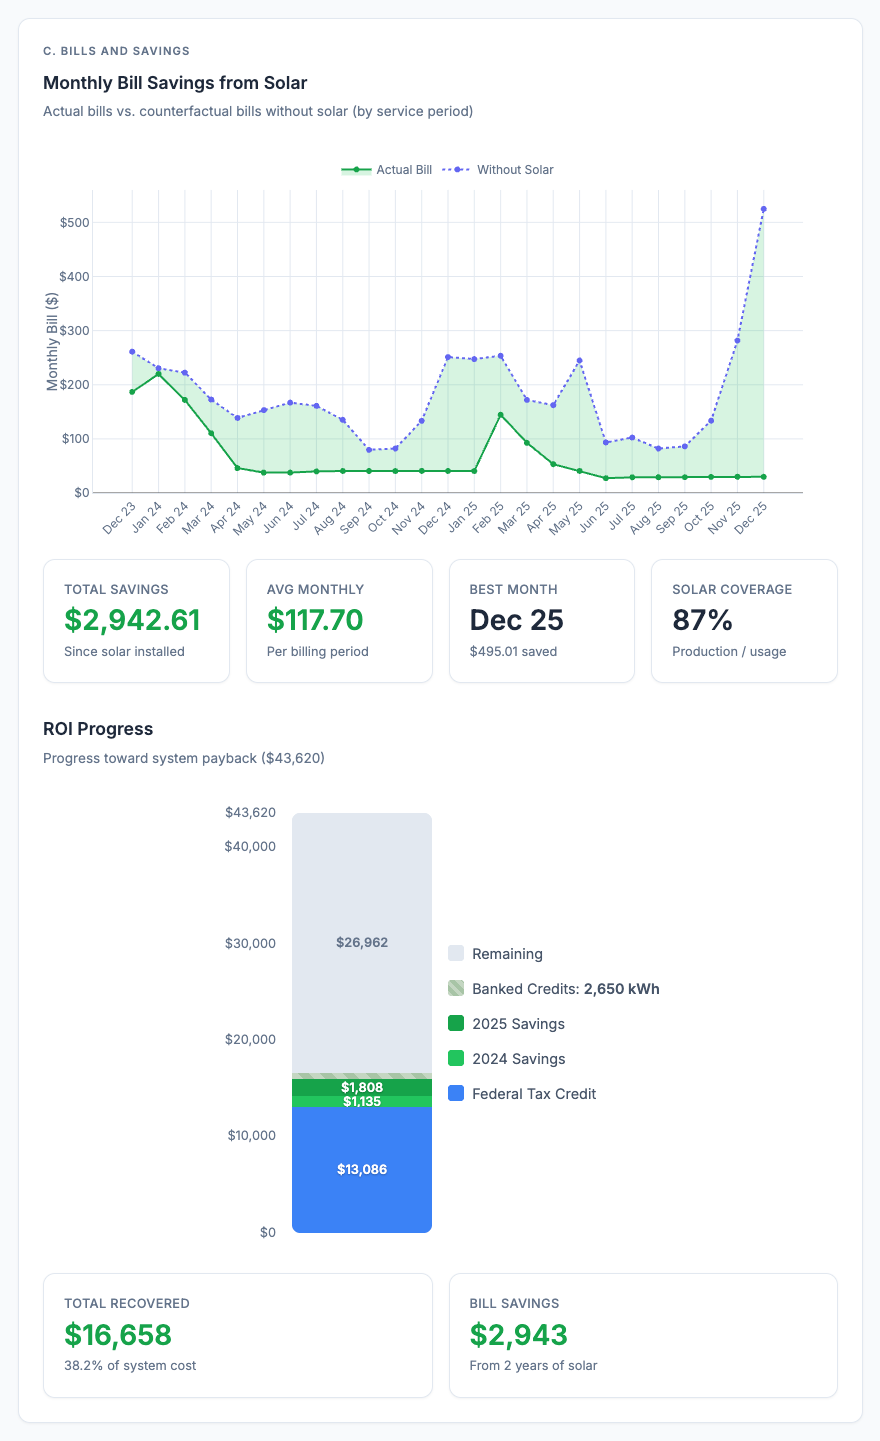
- ROI progress visualization showing federal tax credits, cumulative bill savings, and projected payback timeline
Screenshots
Technical Approach
The dashboard ingests 15-minute interval data from the SolarEdge API and combines it with monthly utility billing records to model energy costs across three CMP rate structures. The system provides real-time monitoring of household energy flow, pattern analysis that reveals how consumption and generation shift across hours, days, seasons, and weather conditions, and rate plan optimization that uses those patterns to identify the most cost-effective CMP rate structure. Credit tracking implements FIFO queue logic to match Maine's 12-month rolling expiration policy, helping homeowners see when they are consistently generating more than they use and could benefit from adopting additional electric technology like heat pumps or EV charging.